nenupy.schedule.constraints.PeriodicCnst
- class nenupy.schedule.constraints.PeriodicCnst(start_time, periodicity, tolerance, weight=1)[source]
Bases:
ScheduleConstraintConstraint to force a block to be scheduled within periodical time intervals in the schedule.
Examples
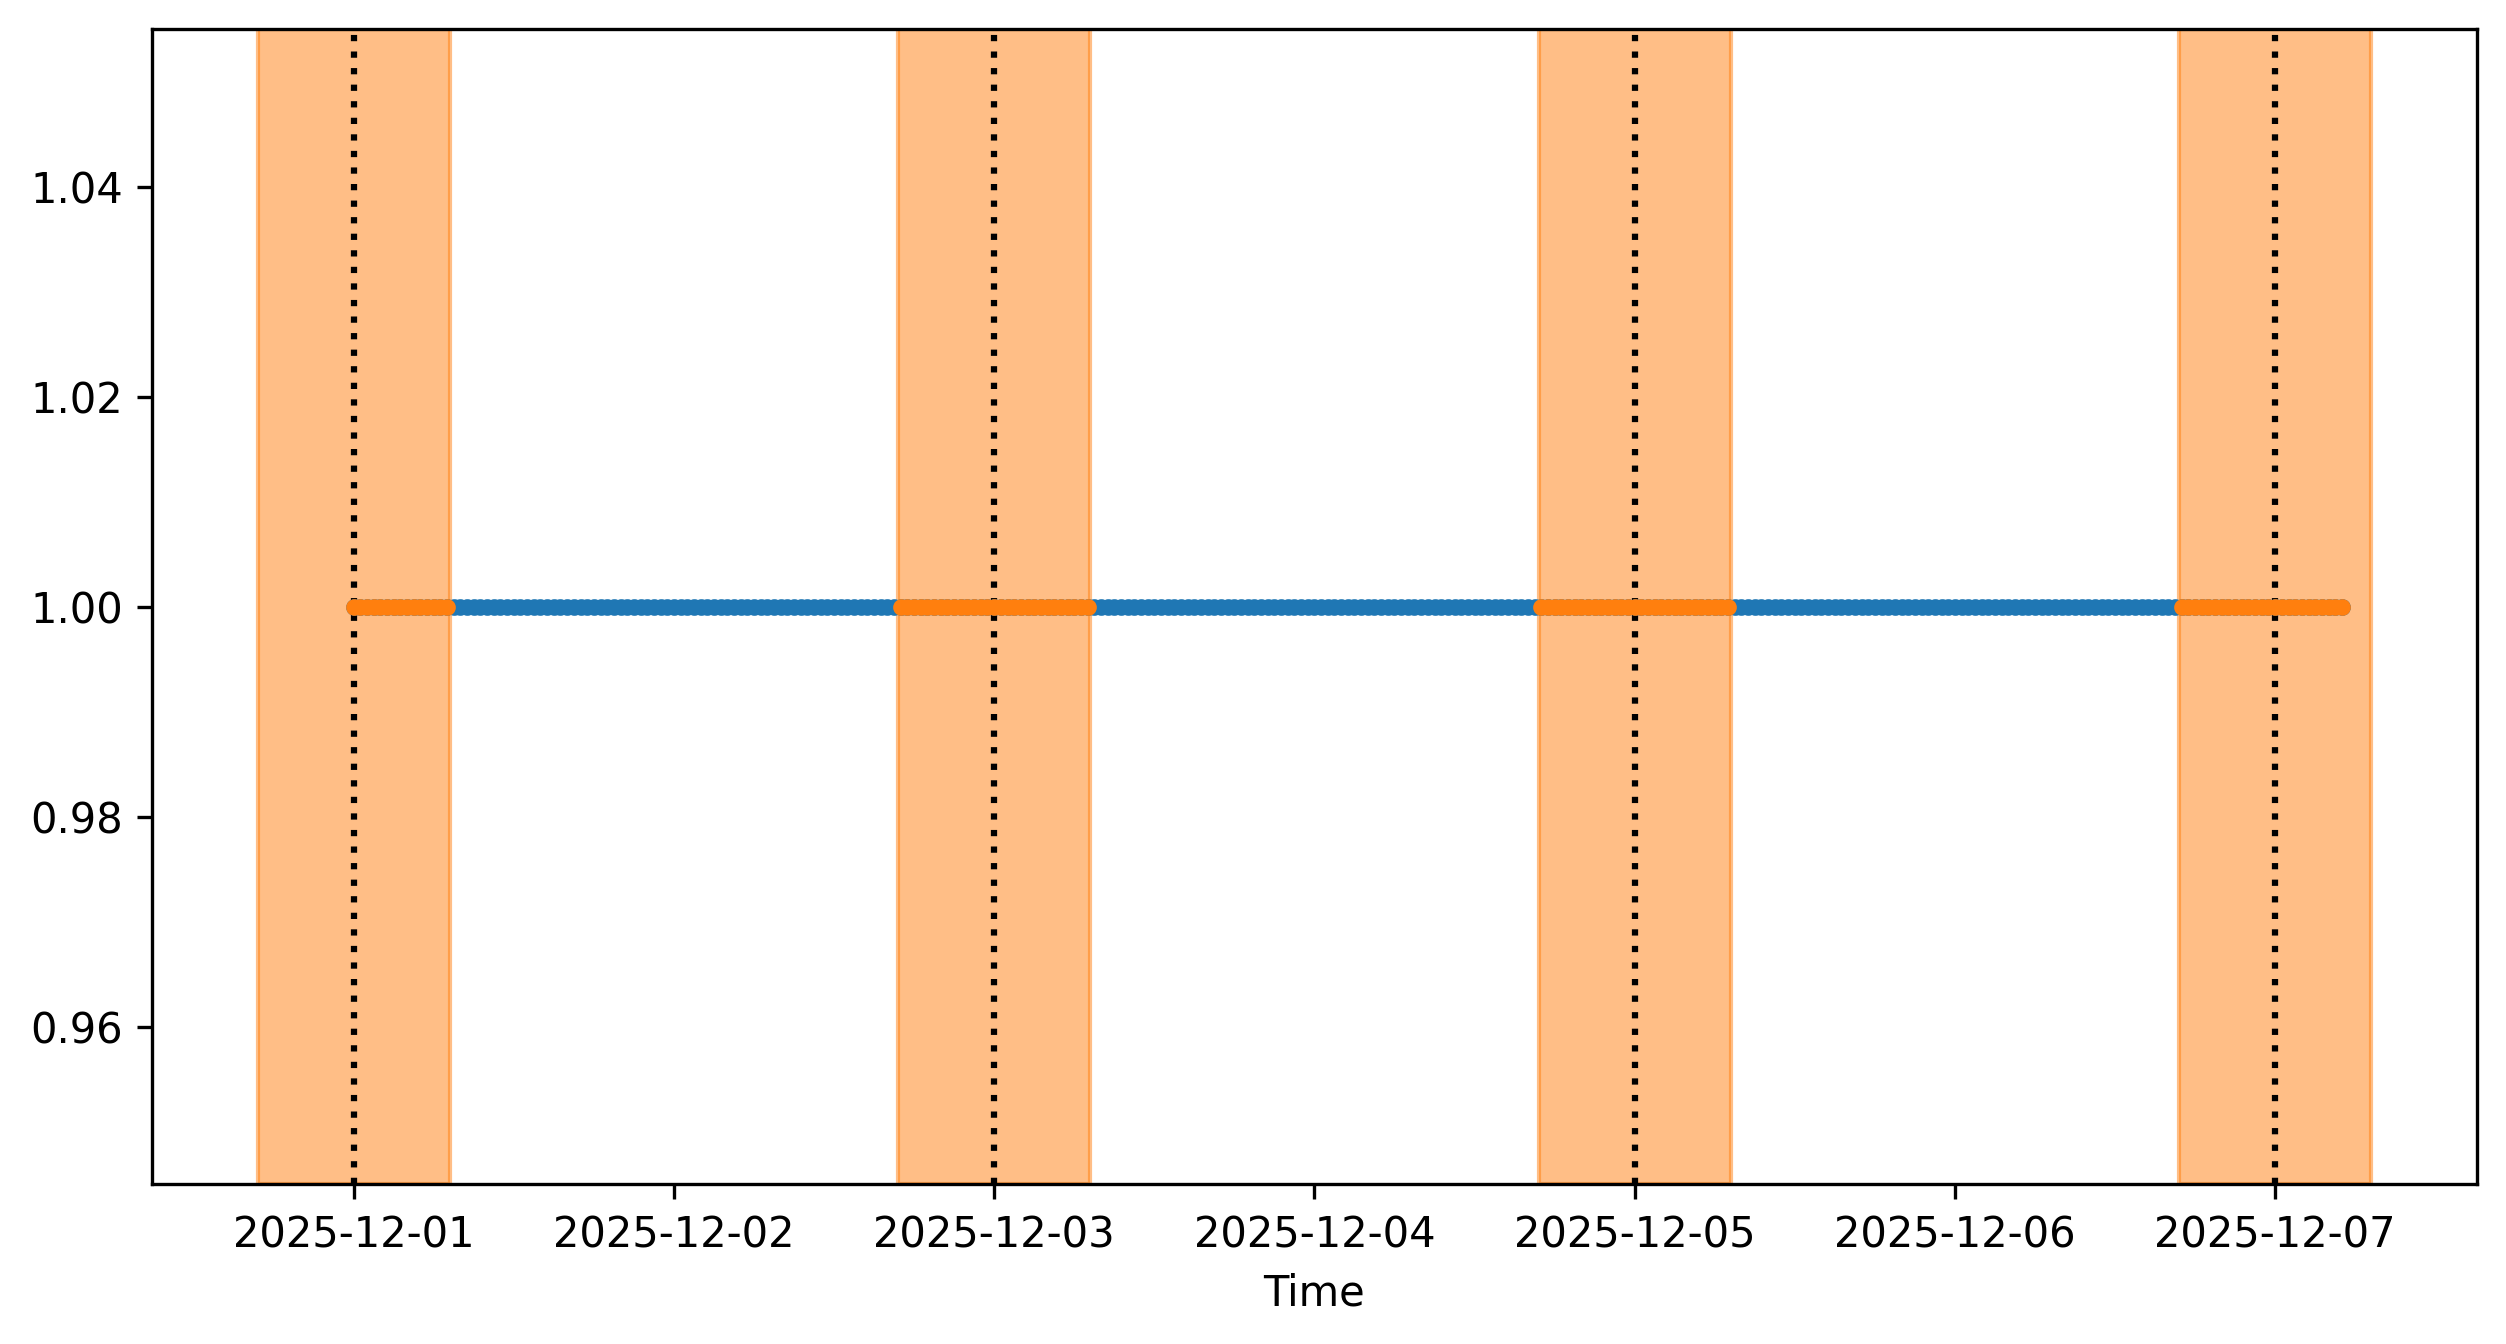
>>> from nenupy.schedule.constraints import PeriodicCnst
>>> from astropy.time import Time, TimeDelta

>>> start = Time("2025-12-01 00:00:00")
>>> p = TimeDelta(2, format="jd")
>>> tol = TimeDelta(0.3, format="jd")
>>> cnt = PeriodicCnst(
        start_time=start,
        periodicity=p,
        tolerance=tol
    )

>>> times = start + np.arange(300) * TimeDelta(1800, format="sec")
>>> score = cnt(times)
>>> fig = plt.figure(figsize=(10, 5))
>>> ax = fig.add_subplot()

>>> for i in range(4):
>>>     middle = start + i * p
>>>     ax.axvline(middle.datetime, linestyle=":", color="black")
>>>     ax.axvspan((middle - tol).datetime, (middle + tol).datetime, color="tab:orange", alpha=0.5)

>>> ax.plot(times[:-1].datetime, np.ones(times[:-1].size), marker=".", linestyle="")
>>> mask = ~ np.isnan(score)
>>> ax.plot(times[:-1].datetime[mask], np.ones(times[:-1].size)[mask], marker=".", linestyle="")
>>> ax.set_xlabel("Time")
- __call__(*arg)
Evaluate the constraint against the schedule properties.
- Returns:
The constraint score evaluated at each time step.
- Return type:
ndarray- Raises:
AttributeError – If the constraint does not have an
_evaluate()method.
- __init__(start_time, periodicity, tolerance, weight=1)[source]
Return an instance of
PeriodicCnst.- Parameters:
start_time (
Time) – Center of the first time interval.periodicity (
TimeDelta) – Time duration before the next repetition of the time interval.tolerance (
TimeDelta) – half-width of each time interval.weight (
float, optional) – Constraint weight used to ponderate constraints with respect to one another, by default 1
Methods
__init__(start_time, periodicity, tolerance)Return an instance of
PeriodicCnst.get_score(indices)Return the constraint score evaluated on a schedule
indices.plot([fig, ax])Plot the constraint's score previously evaluated.
Attributes
Relative weight associated to the constraint.
- get_score(indices)[source]
Return the constraint score evaluated on a schedule
indices. The constraint must have been evaluated first.- Parameters:
indices (
ndarray) – Time indices on which the constraint score should be computed. The indices must match the array stored inscore.- Returns:
The constraint score evaluated as its average on
indices.- Return type:
- plot(fig=None, ax=None, **kwargs)
Plot the constraint’s score previously evaluated.
- Parameters:
fig (
Figure) – Figure instance to re-use for plotting purposes, by defaultNone(i.e., a newFigurewill be created)ax (
Axes) – Ax instance to re-use for plotting purposes, by defaultNone(i.e., a newAxeswill be created)figsize ([
float,float]) – Size of the figure, by default(10, 5)figname (
str) – Name of the figure to be saved, by default''(i.e., the figure is only displayed)marker (
str) – Plot marker type (seematplotlib.pyplot.plot()), by default'.'linestyle (
str) – Plot line style (seematplotlib.pyplot.plot()), by default':'linewidth (
int) – Plot line width (seematplotlib.pyplot.plot()), by default1
- property weight
Relative weight associated to the constraint. The constraint score of an observation block within a given schedule is ultimately taken at the weighted mean among all the constraints associated to this observaiton request.