Beamlet STatistics (BST)
NenuFAR delivers BST statistical data from the LaNewBA receiver. Beamlet STatistics (BST) are the beamlet outputs per polarization averaged at 1 s resolution
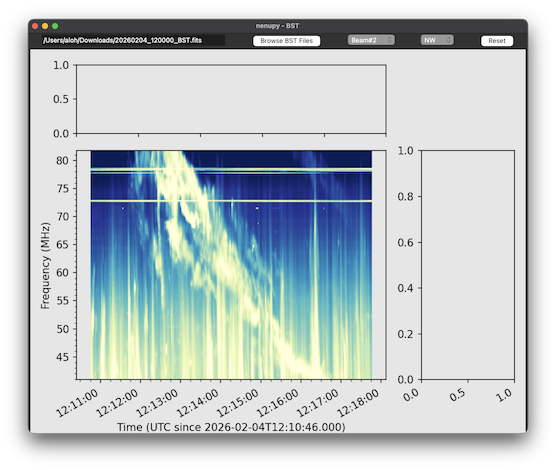
BST reading interface
nenupy offers a graphical interface to ease quick reading of a BST file.
Once the package is installed, the user should be able to call the script nenupy_bst_vis from anywhere:
nenupy_bst_vis
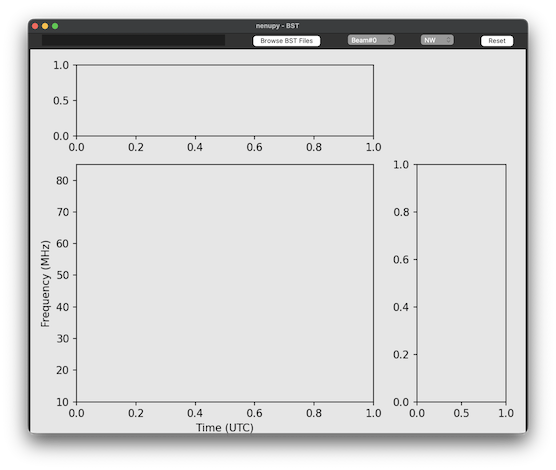
BST reading interface, one can either enter the path toward the BST file to open or select a file in your working environment.
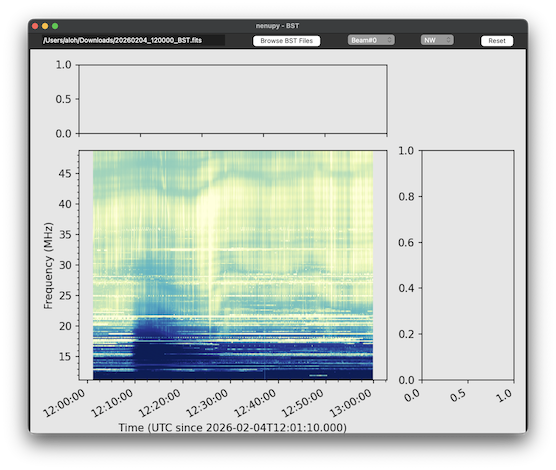
Once the BST file is selected, the first digital beam recording is shown in NW polarization.
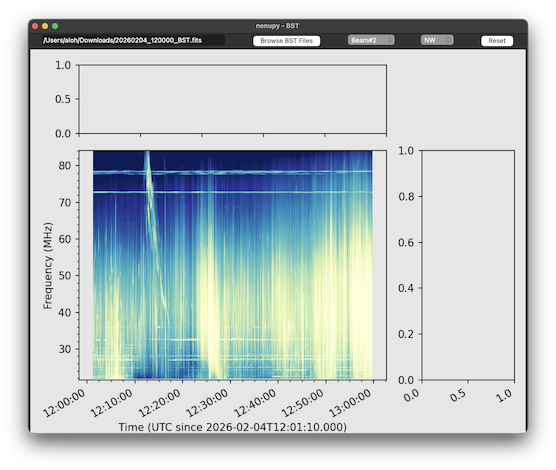
It is possible to set the digital beam value (here #2) and the polarization channel. The content of the dynamic spectrum is automatically updated.
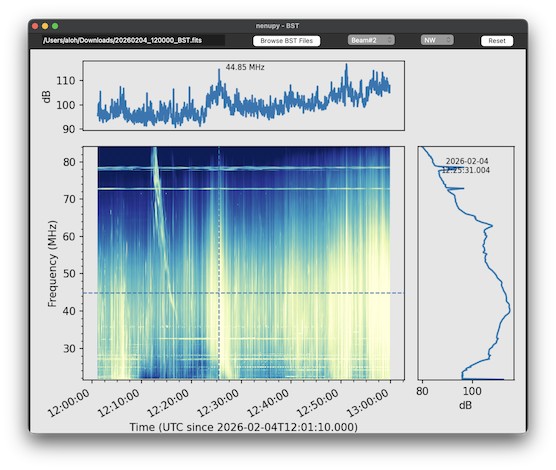
A right click displays both time and frequency profiles at the corresponding position in the dynamic spectrum.
Left click, then drag and drop motion allows to zoom in a particular time and frequency region. The button ‘Reset’ enables to go back to the full original dynamic spectrum.
BST reading
from nenupy.io.bst import BST

bst = BST("/path/to/BST.fits")
BST data selection
data = bst.get(
    frequency_selection="<=52MHz",
    time_selection=">=2022-01-24T11:08:10 & <2022-01-24T11:14:08",
    polarization="NW",
    beam=8
)
data is a ST_Slice object.
See … for this class usage.